We use cookies (and other similar technologies) for many purposes, including to improve your experience on our site and for ads and analytics.
One leaderboard. Every KPI you track.
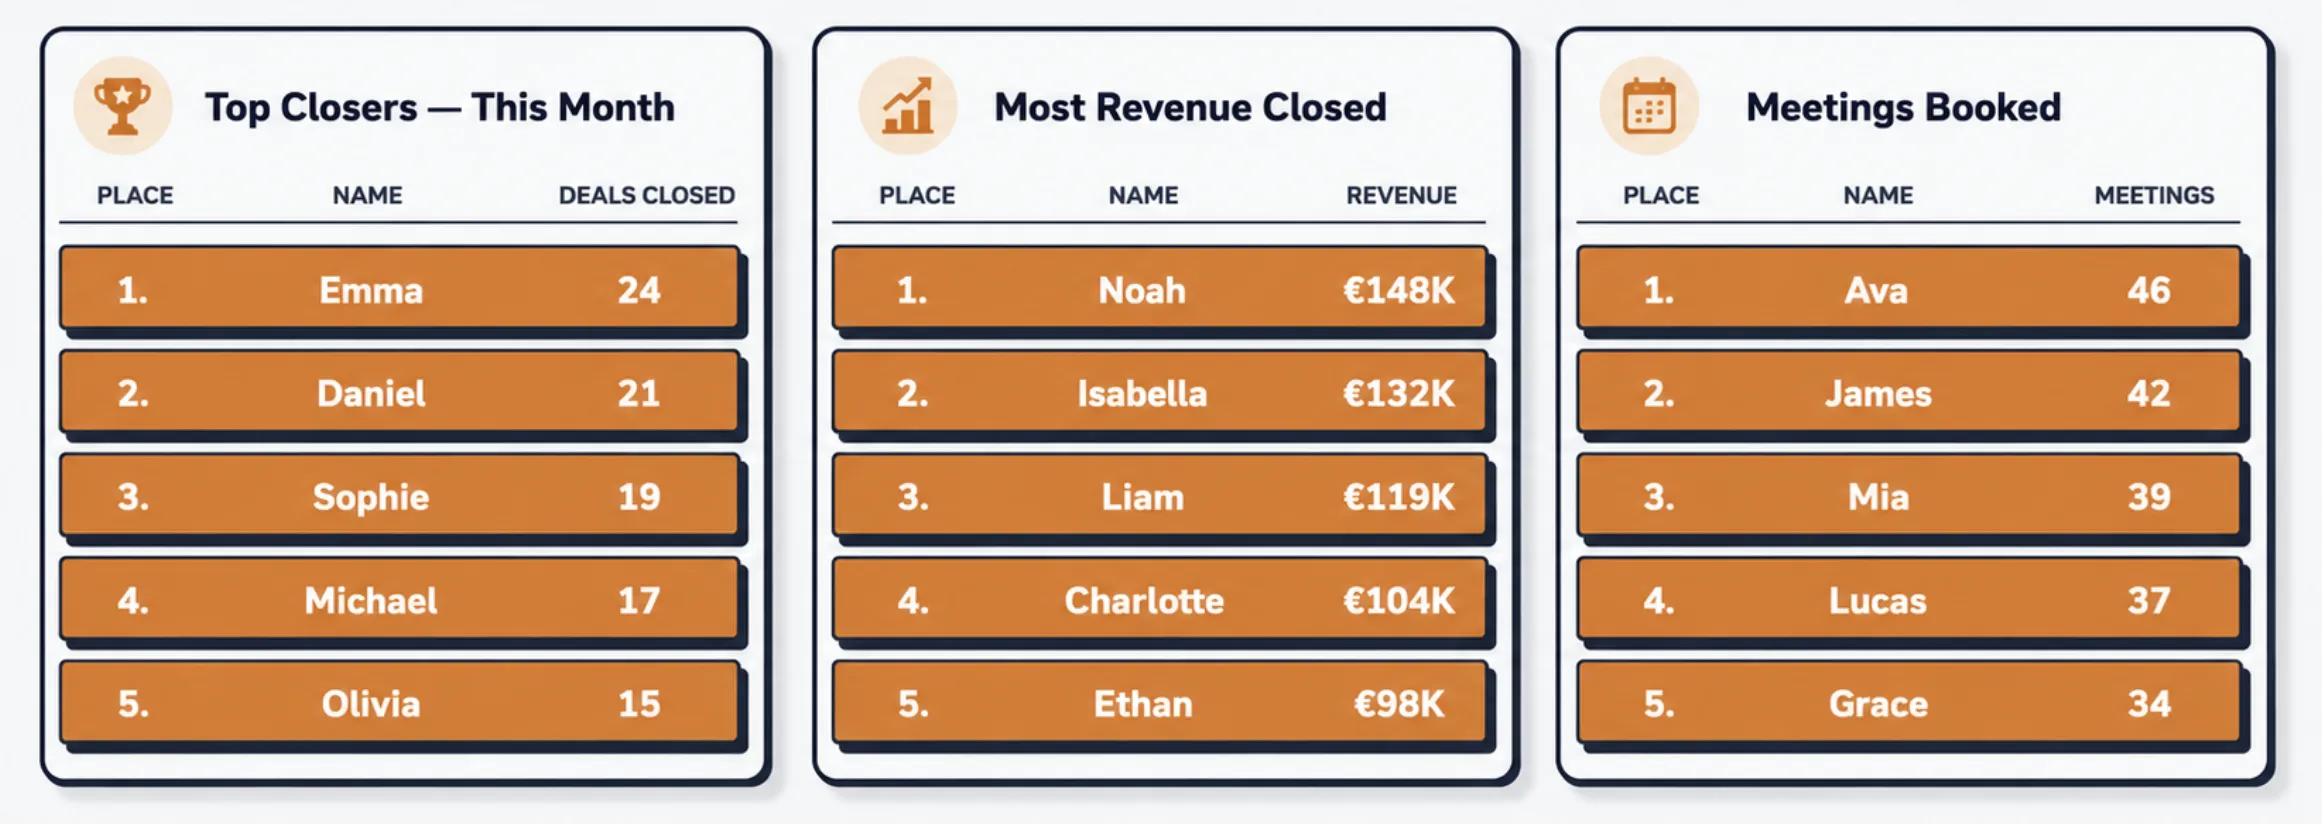
Most leaderboards show a single number. BoardQ tracks several KPIs per person - deals, calls, CSAT, handle time - ranks by the one that matters, and shows the rest right in each row. Turn it on in settings; nothing else changes.
One number never tells the whole story.
Rank reps by revenue and the SDR grinding 80 dials a day looks like they're losing. Rank support by tickets closed and your highest-CSAT agent disappears. The fix isn't a second board - it's one board that ranks by the metric that matters and keeps every other KPI in view.
Rank by what counts
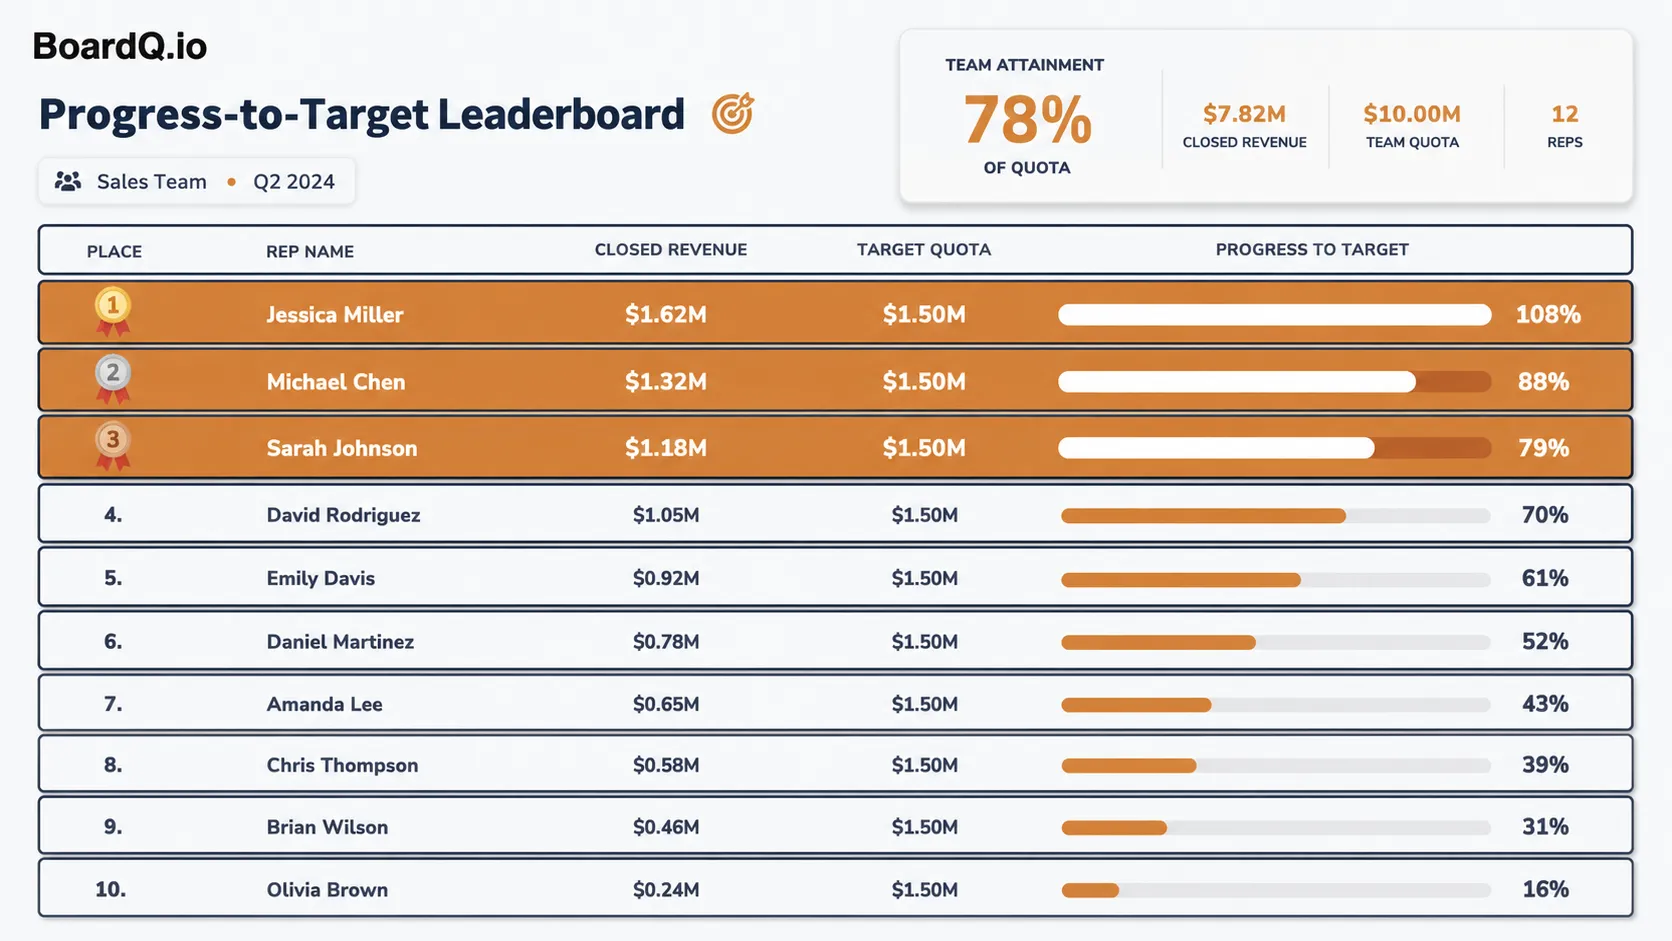
Pick one primary metric and the board sorts by it, cleanly. The leaderboard stays unambiguous - there's exactly one number that decides the order.
Keep the context visible
Every other KPI sits in the row, so a manager can see who's ahead on revenue but light on activity - or closing the most tickets at the lowest CSAT.
No more board sprawl
Stop spinning up a separate board per metric. One roster, one screen, all the KPIs - far less to maintain and far easier to read on the wall.
Every metric you care about, in one row.
Add as many units as you track. Each person carries a value for every KPI, shown as an aligned column or a compact pill depending on the layout - so the whole team reads one row and sees the full picture.
- Add unlimited KPI units per board
- Aligned columns on the ranked table and podium
- Compact pills on bars, mosaic, arcs and bubbles
- Values update live as you push new scores
You choose the number that decides the winner.
Mark any KPI as the main unit and the board ranks by it - exactly like a single-metric leaderboard. The rest become context. Change your mind mid-quarter? Switch the primary metric and the board re-sorts instantly.
- One tick sets the ranking metric
- Sorting behaves just like a classic leaderboard
- Switch the primary KPI anytime - no data lost
- Primary column is visually emphasised in each row
Sensible KPIs, pre-loaded for your team.
Pick a use case and BoardQ pre-fills the units most teams track. Tick the ones you want, drop the ones you don't, and add your own on top - "Upsells", "NPS", whatever your team measures.
- Sales - deals closed, revenue, calls, meetings booked
- Support - resolved tickets, CSAT, first response time
- Call center - calls answered, handle time, talk time
- Your own - add any custom unit with a number
Wherever a person is more than one number.
If you measure people on a mix of output and quality, a multi-KPI board keeps the whole picture on one screen.
Sales Activity + Outcome
Rank by revenue, but keep calls, meetings and demos in view so the activity behind the number is never invisible.
Support Quality Boards
Rank by resolved tickets while showing CSAT and first-response time, so speed never comes at the cost of quality.
Call Center Scorecards
Calls answered, resolved calls, average handle time and talk time - all per agent, ranked by whichever matters this month.
CRM & Help Desk Feeds
Push each KPI from Salesforce, HubSpot, Zendesk or a sheet via the REST API. Every metric updates the moment the source does.
Balanced Scorecards
Reward more than raw output. Show the mix of metrics a fair ranking actually depends on - publicly, in real time.
Office TV Dashboards
Big, high-contrast KPI columns built to be read from across the floor - and they auto-refresh, no reloading.
Classroom & Training
Track attendance, quiz scores and participation together, then rank by whichever the lesson is about that week.
Fitness & Challenges
Steps, workouts, points - several challenge metrics per member on one board, with one of them crowning the leader.
Push every KPI from the source of truth.
Don't make anyone hand-update the board. Send the primary score and every secondary KPI in one call - from your CRM, help desk, or a scheduled job. The row updates live across every screen.
- Salesforce / HubSpot - fire on deal stage change
- Zendesk / Intercom - push CSAT and resolution counts
- Google Sheets / Zapier - sync KPIs on a schedule
- Your own stack - any tool that can POST JSON
# Send the primary score plus every secondary KPI
curl -X POST https://api.boardq.io/v1/scores \
  -H "Authorization: Bearer $BOARDQ_API_KEY" \
  -H "Content-Type: application/json" \
  -d '{
    "board_id": "q4-sales-kpis",
    "participant": "Jessica Miller",
    "score": 162000,
    "kpis": { "deals_closed": 14, "calls_made": 380, "meetings_booked": 22 }
}'Multi-KPI tracking, without the spreadsheet.
🧰 Pick a use case
Choose Sales, Support or Call center and BoardQ pre-loads the units that team usually tracks.
☑️ Toggle the units
Tick the KPIs you want on the board, untick the ones you don't. Add custom units for anything else.
🥇 Choose the main metric
One radio button sets the ranking metric. The board sorts by it; the rest become context columns.
👀 Live row preview
The settings panel shows a preview row as you go, so you know exactly how the board will read before you save.
🎨 Works on every theme
KPI columns and pills inherit each theme's colours, light or dark, so they always stay legible.
🔌 REST API + webhooks
Push the primary score and all secondary KPIs in a single call from any tool that can POST JSON.
🔄 Real-time updates
Every KPI refreshes live across all screens over WebSocket - no reloading the office TV.
↩️ Off by default
Leave Custom KPIs off and the board works exactly as before. Turn it on only where you need it.
Only need one number? Leave it off.
Custom KPIs are entirely optional. With the feature off you get a clean, single-metric leaderboard - rank, name, number. Turn it on later when one number isn't enough.
Pick a template →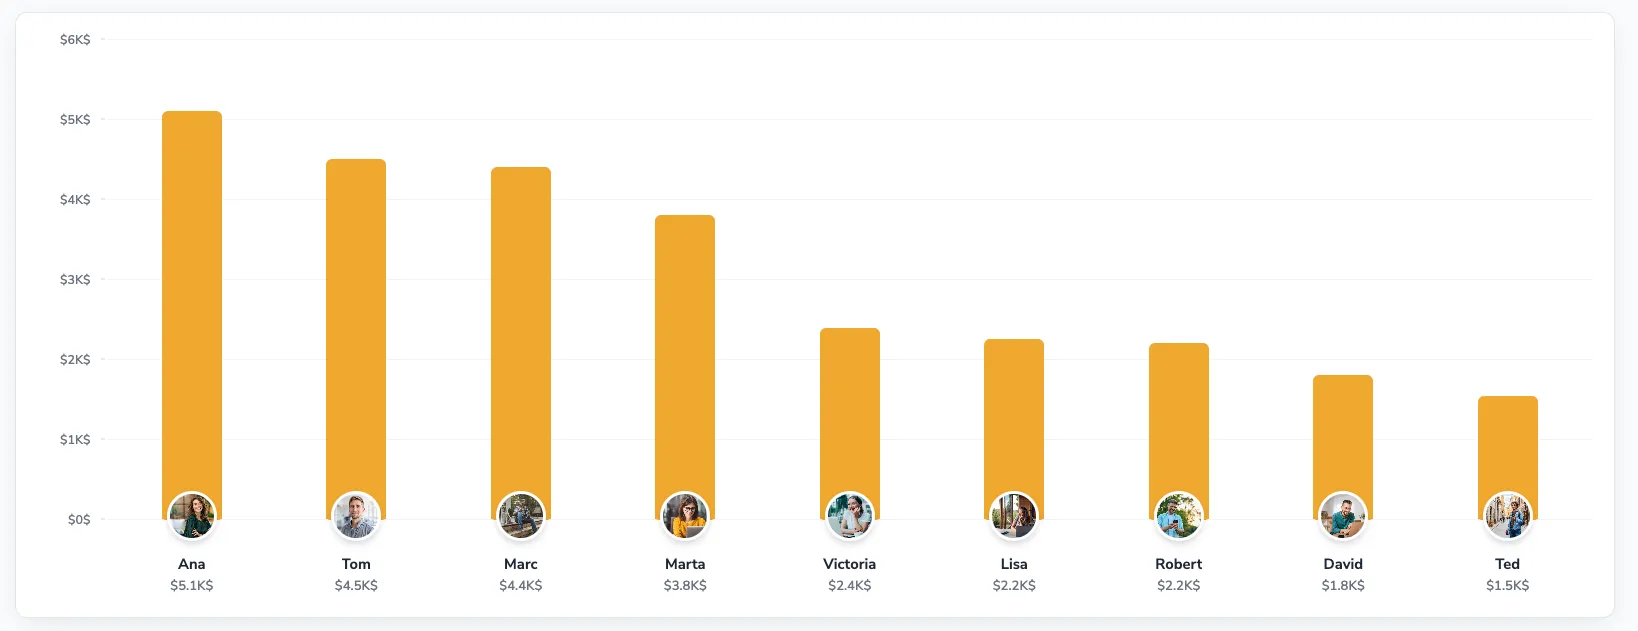
“We used to run three boards - revenue, dials, meetings. Nobody knew which one mattered. Now it's one board ranked by revenue with the activity right next to it. The arguments stopped.”
Common questions.
Can I track more than one KPI per person?
Yes. Turn on Custom KPIs and add as many units as you track - deals closed, revenue, calls made, CSAT, handle time. You pick one as the primary metric, which drives the ranking; every other KPI is shown alongside each person's row.
Which metric decides the ranking?
The one you mark as the main unit. The board sorts by that single number exactly as before, so the leader is unambiguous. The remaining KPIs are context columns - they're displayed but don't change the order.
Are there ready-made KPI packs?
Yes. Pick a use case - Sales, Support or Call center - and BoardQ pre-loads sensible units (e.g. deals closed and revenue for sales; resolved tickets and CSAT for support; calls answered and handle time for call centers). Tick the ones you want and add your own on top.
Can I add my own custom units?
Yes. Beyond the presets you can add any unit you track - "Upsells", "Demos", "NPS", anything with a number. Name it, optionally make it the primary ranking metric, and it appears as a column in every row.
Do custom KPIs work on every board type?
Yes. The extra KPIs render as compact columns or pills across the layouts - podium, bars, mosaic, arcs, bubbles and the ranked table - and adapt to each theme. When custom KPIs are off, the board looks and behaves exactly as before.
How do KPI values get onto the board?
Update them by hand in the editor, or push them through the REST API from your CRM, help desk or a spreadsheet automation. Each person can carry a value for every KPI, updated live over WebSocket.
Put every KPI on one board in 60 seconds.
Free to start. Unlimited participants. No credit card. Turn on Custom KPIs only where you need them.
No setup fee · No contract · Cancel anytime