We use cookies (and other similar technologies) for many purposes, including to improve your experience on our site and for ads and analytics.
The real-time sales dashboard built for the office TV.
Put your sales KPIs on the wall. BoardQ turns CRM data into a live sales performance dashboard - activity, pipeline, quota and target attainment per rep - that the whole team can see at a glance. Pull scores from Salesforce, HubSpot or any CRM and have it on the office TV in under a minute.

Your CRM has the data. Nobody's looking at it.
The numbers are all in Salesforce or HubSpot - buried in reports and a spreadsheet nobody opens. A real-time sales dashboard on the office TV puts the metric that matters in front of the whole team, all day, and watches the numbers move.
Every KPI in one glance
Revenue, calls, meetings, pipeline, quota - one live sales KPI dashboard instead of five browser tabs and a weekly export.
Targets the whole team can see
A visible sales target dashboard turns quota into a daily race instead of a quarter-end surprise. Everyone knows where they stand.
Always live, never stale
Close a deal and the dashboard updates the moment it lands - real-time, on the office TV, no refresh button and no nightly batch.
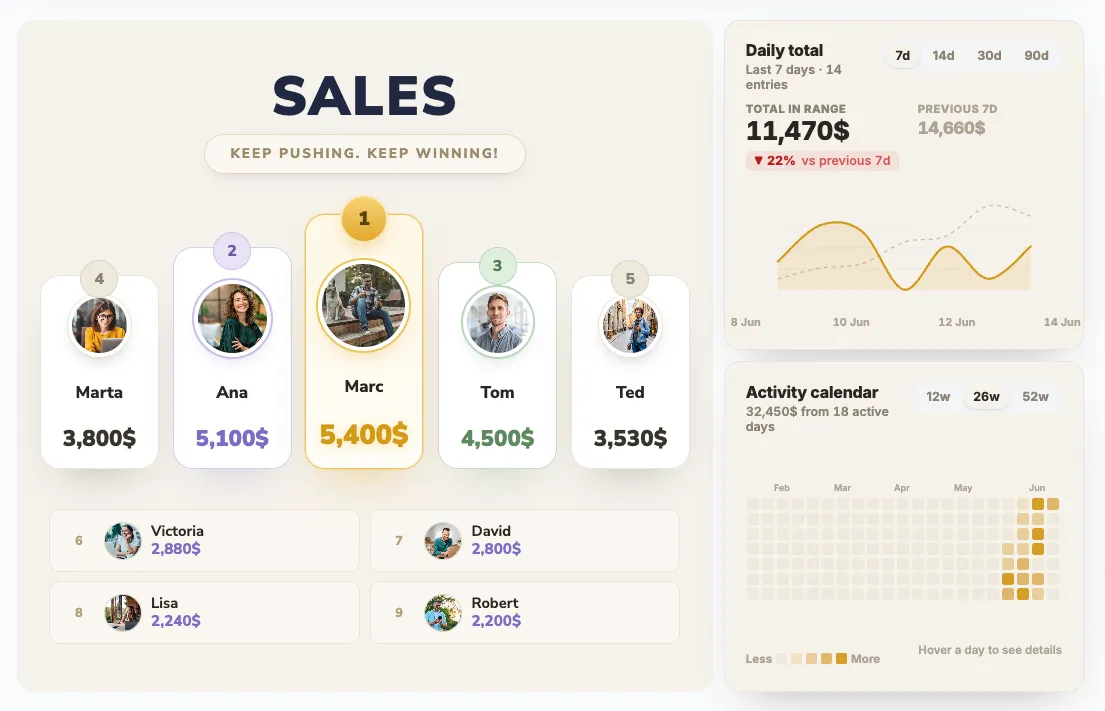
Every rep, ranked by the KPI that matters - in real time.
Each rep gets a bar sized by their number - revenue, deals closed, calls made - and the leader pulls ahead live as activity is logged. Big, readable and built to be watched from across the sales floor.
- Rep photos on every bar, standings update live
- Any sales KPI - revenue, deals, calls, pipeline
- Period-over-period deltas with trend arrows
- Dark theme tuned for large office displays
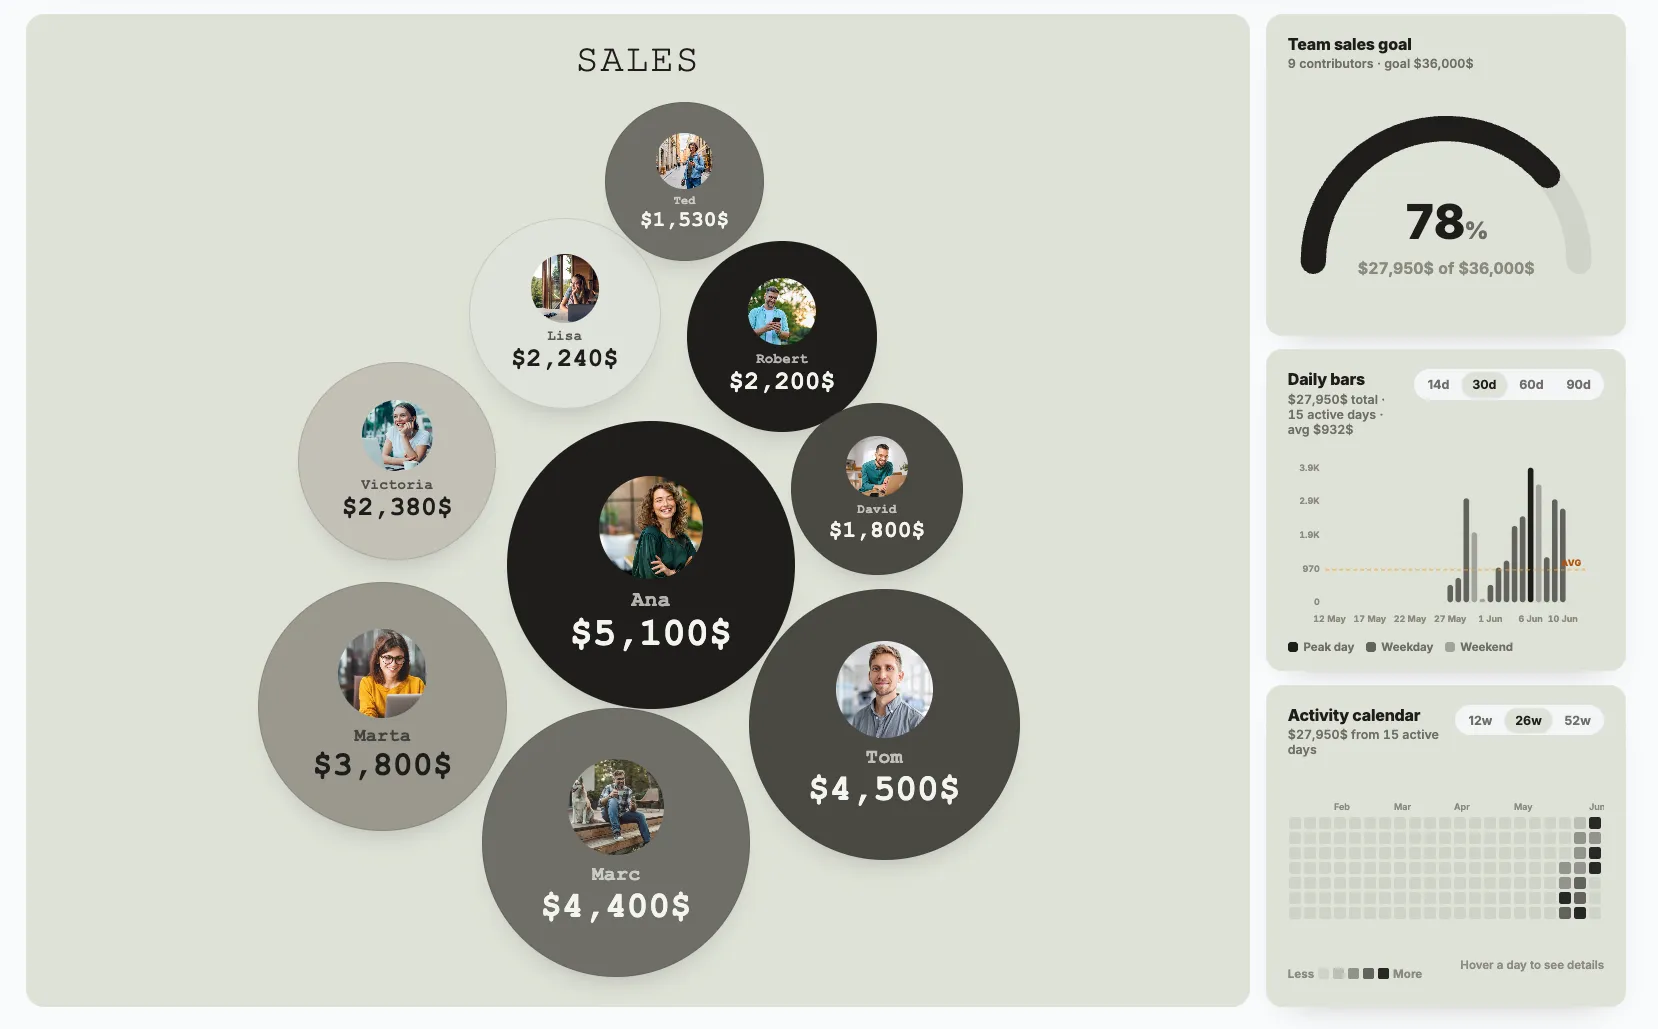
A sales quota dashboard everyone can read from their desk.
The progress-to-target view shows each rep's closed revenue, their quota and a live progress bar - plus the team's overall attainment as the headline number. Set monthly, quarterly or annual targets and watch the bars fill as deals close.
- Individual quota per rep or a shared team target
- Team attainment headline metric, always on screen
- Color-coded progress bars (red → orange → green)
- Auto-rollover at the end of each period
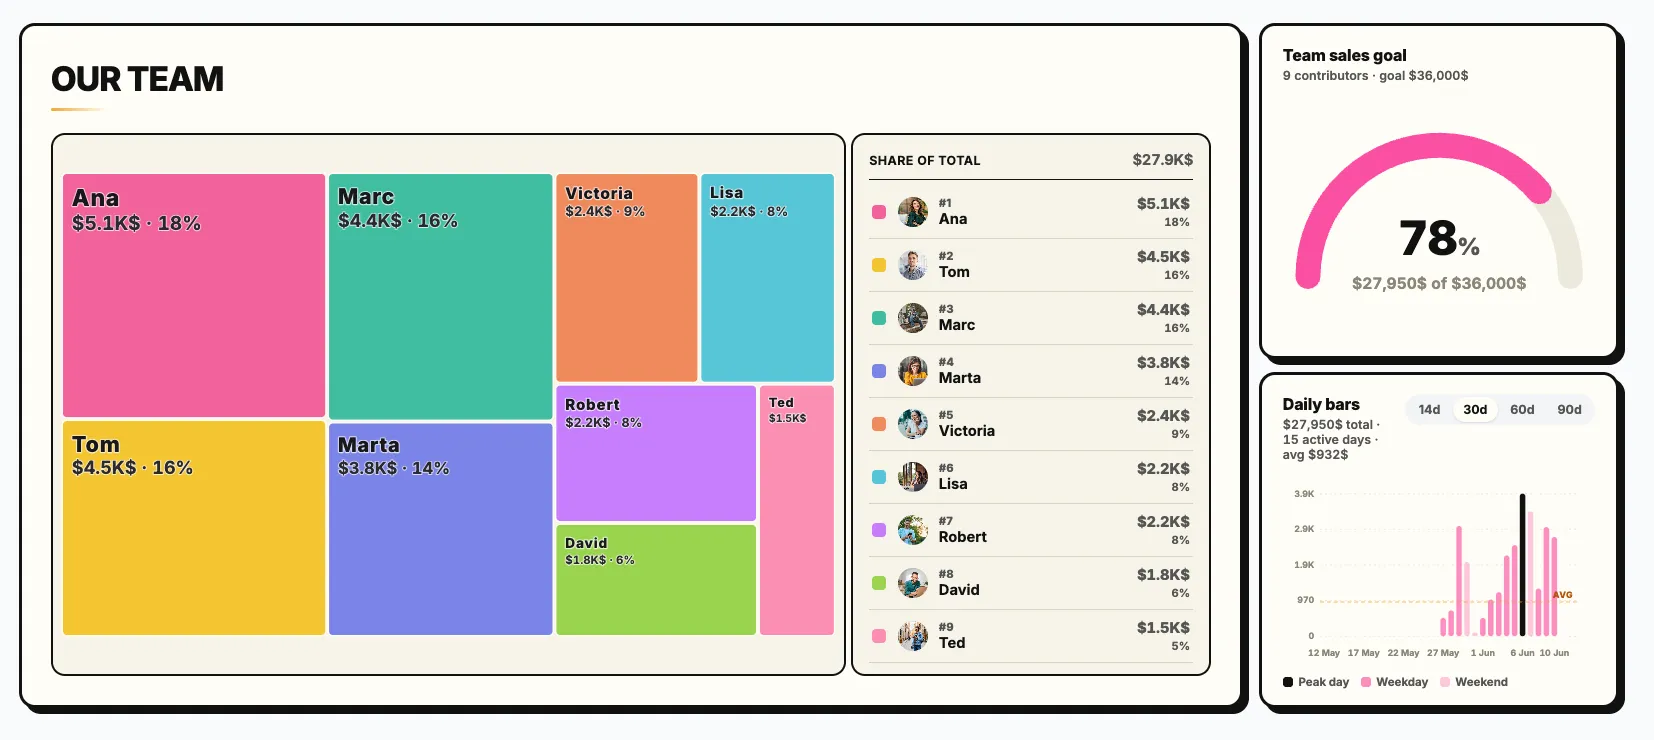
A sales activity dashboard that shows who's doing the work.
The share-of-total view sizes every rep by their contribution, so the whole team can see who's carrying the quarter and who needs a coaching nudge. Track outbound effort on one dashboard and closed revenue on another off the same roster.
- Each rep sized by their share of total activity
- Ranked list with exact amounts and percentages
- Run multiple dashboards off one team roster
- Bold, color-coded tiles built for the office TV
One dashboard, every sales motion.
From outbound SDR rooms to enterprise AE teams to RevOps reviews - a live dashboard works wherever there's a number to track.
Office TV Dashboards
Display the sales dashboard on office TVs or wall-mounted screens. Real-time updates - no browser refreshing needed.
SDR Activity Dashboards
Calls made, emails sent, meetings booked. Track pipeline generation live and watch dial counts climb week one.
Quota & Target Tracking
A live quota dashboard with progress bars per rep and a team attainment headline that's always on screen.
CRM Dashboard for Your Team
Push KPIs straight from Salesforce, HubSpot, Pipedrive or Close via REST API. The dashboard updates the moment a deal closes.
Revenue & Pipeline Boards
Closed revenue, new logos, pipeline created - the headline numbers leadership wants visible, refreshed in real time.
Quarter-End Sprints
Light up the office for the final week. Live deltas, big numbers, big screen - the last-mile push with visible momentum.
New-Hire Ramp Tracking
Track new-rep milestones during onboarding: first call, first demo, first deal. Build momentum from day one.
Remote & Hybrid Teams
Share the dashboard in Slack and Teams, or embed it in Notion. Distributed reps see the same live numbers as the office TV.
Feed the dashboard from your CRM in three lines.
Don't make your reps update the board. Don't make RevOps copy-paste from Salesforce. Push KPIs straight from the source of truth - a Zapier webhook, a workflow rule, or one curl from your terminal.
- Salesforce - fire on Opportunity Closed Won
- HubSpot - workflow webhook on deal stage change
- Pipedrive / Close / Outreach - Zapier or direct webhook
- Your own stack - any tool that can POST JSON
# Fire this from your CRM webhook when a KPI changes
curl -X POST https://api.boardq.io/v1/scores \
  -H "Authorization: Bearer $BOARDQ_API_KEY" \
  -H "Content-Type: application/json" \
  -d '{
    "board_id": "q4-sales-dashboard",
    "participant": "Jessica Miller",
    "score": 162000,
    "unit": "$"
}'Everything a sales dashboard needs. Nothing it doesn't.
⚡ 60-second setup
Create a dashboard, add reps, share the link. No software to install, no data modelling, no IT project.
🔄 Real-time updates
KPIs update live across every screen over WebSocket. Log activity from your phone, the office TV refreshes instantly.
📺 Built for the office TV
Full-screen, high-contrast themes designed to be readable from across the sales floor.
🖥️ Embed anywhere
Drop the dashboard into Slack, Teams, Notion or your sales intranet with a single iframe.
🎨 Custom branding
Upload your logo, pick your colors. Make the dashboard feel like it belongs in your office.
🔌 REST API + webhooks
Push from Salesforce, HubSpot or anywhere. Pull standings into weekly QBR decks programmatically.
🔒 Private dashboards
Password-protect dashboards so commission and revenue numbers stay inside the company.
📱 Works on every device
Reps check the dashboard from their phone between meetings. Works in any browser, no app to install.
Just want a clean KPI board? Done.
Not every team needs avatars and gauges. If you just want rank, name and a number on the wall - that's one of our templates too. Pick a theme, start pushing scores, ship it to the office TV.
Pick a template →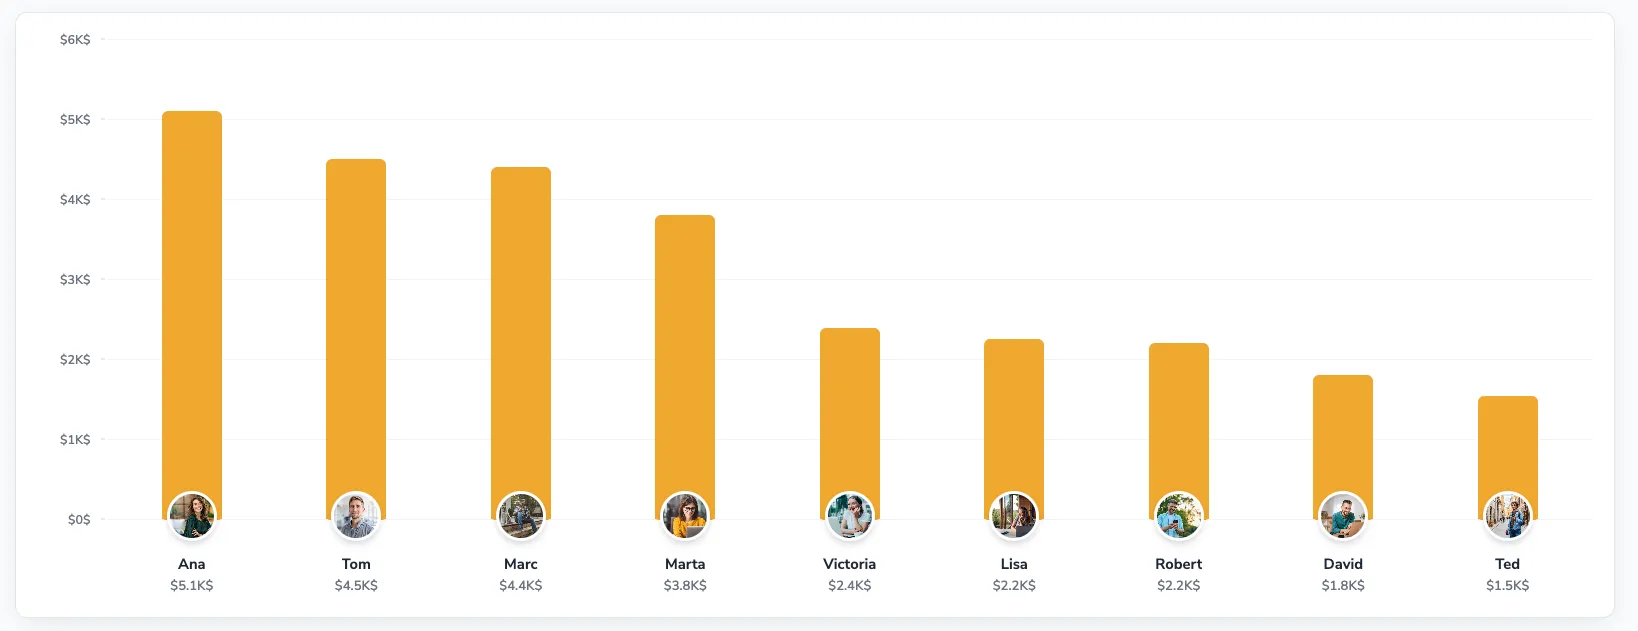
“We had the data in HubSpot the whole time - nobody looked at it. We put BoardQ on the sales-floor TV as a live dashboard and now the team self-corrects without me chasing numbers. Outbound dials were up 38% by Friday.”
Common questions.
What is a sales performance dashboard?
A single live view of the numbers that drive a sales team - revenue, deals, calls, pipeline, quota and target attainment - shown in real time so the whole team can see where they stand. BoardQ turns your CRM data into a sales KPI dashboard you can put on the office TV in under a minute.
Can I run it as an office TV dashboard?
Yes - that's the primary use case. Open the dashboard in any browser on a smart TV, click full-screen, and it auto-refreshes via WebSocket. The dark theme is tuned for large displays.
Is it a real-time sales dashboard?
Yes. Every score updates live the moment it changes - push a closed deal from your CRM and the office TV refreshes instantly. No nightly batch, no refresh button.
Can it work as a quota or target dashboard?
Yes. Set a quota per rep or a shared team target and the dashboard shows a live progress bar toward goal for each person plus overall team attainment - a sales quota and target dashboard in one view.
Does it pull data from my CRM?
Yes. BoardQ exposes a REST API. Push KPIs from Salesforce, HubSpot, Pipedrive, Close or anything that supports webhooks. Zapier works too if you don't want to write code.
Which sales KPIs can I track?
Anything with a number: revenue, deals closed, calls made, meetings booked, demos given, pipeline generated, win rate or quota attainment. You set the unit label to match each KPI.
Is the dashboard free?
Yes. The free plan includes 2 dashboards with unlimited reps, real-time updates, all themes and API access. Premium starts at $8.99/month for unlimited dashboards and custom branding.
How is this different from a BI dashboard?
BI tools and spreadsheets are built for analysts and live in a tab nobody opens. BoardQ is a glanceable, big-screen sales dashboard the whole floor watches - set up in a minute, no data modelling. It complements your CRM and BI stack, not replaces it.
Your sales dashboard can be live on the TV in 60 seconds.
Free to start. Unlimited reps. No credit card. Upgrade only when you need more dashboards or custom branding.
No setup fee · No contract · Cancel anytime