We use cookies (and other similar technologies) for many purposes, including to improve your experience on our site and for ads and analytics.
The real-time support dashboard built for the office TV.
Put your support KPIs on the wall. BoardQ turns help desk data into a live customer support dashboard - resolved tickets, CSAT, SLA and handle time per agent - that the whole team can see at a glance. Pull scores from Zendesk, Freshdesk or Intercom and have it on the office TV in under a minute.
Your help desk has the metrics. Nobody's watching them.
Zendesk tracks every ticket. Your QA sheet has the CSAT. But the reports live in a tab nobody opens. A real-time customer support dashboard on the office TV puts the metric that matters in front of the whole floor - and watches handle times drop and resolutions climb.
Every KPI in one glance
Resolved tickets, CSAT, SLA, handle time - one live support KPI dashboard instead of five help desk reports and a weekly export.
Targets the whole team can see
A visible support team dashboard turns the day's goal into a shared target. Everyone knows how close the queue is to clear.
Always live, never stale
Resolve a ticket and the dashboard updates the moment it closes - real-time, on the office TV, no refresh button and no nightly batch.
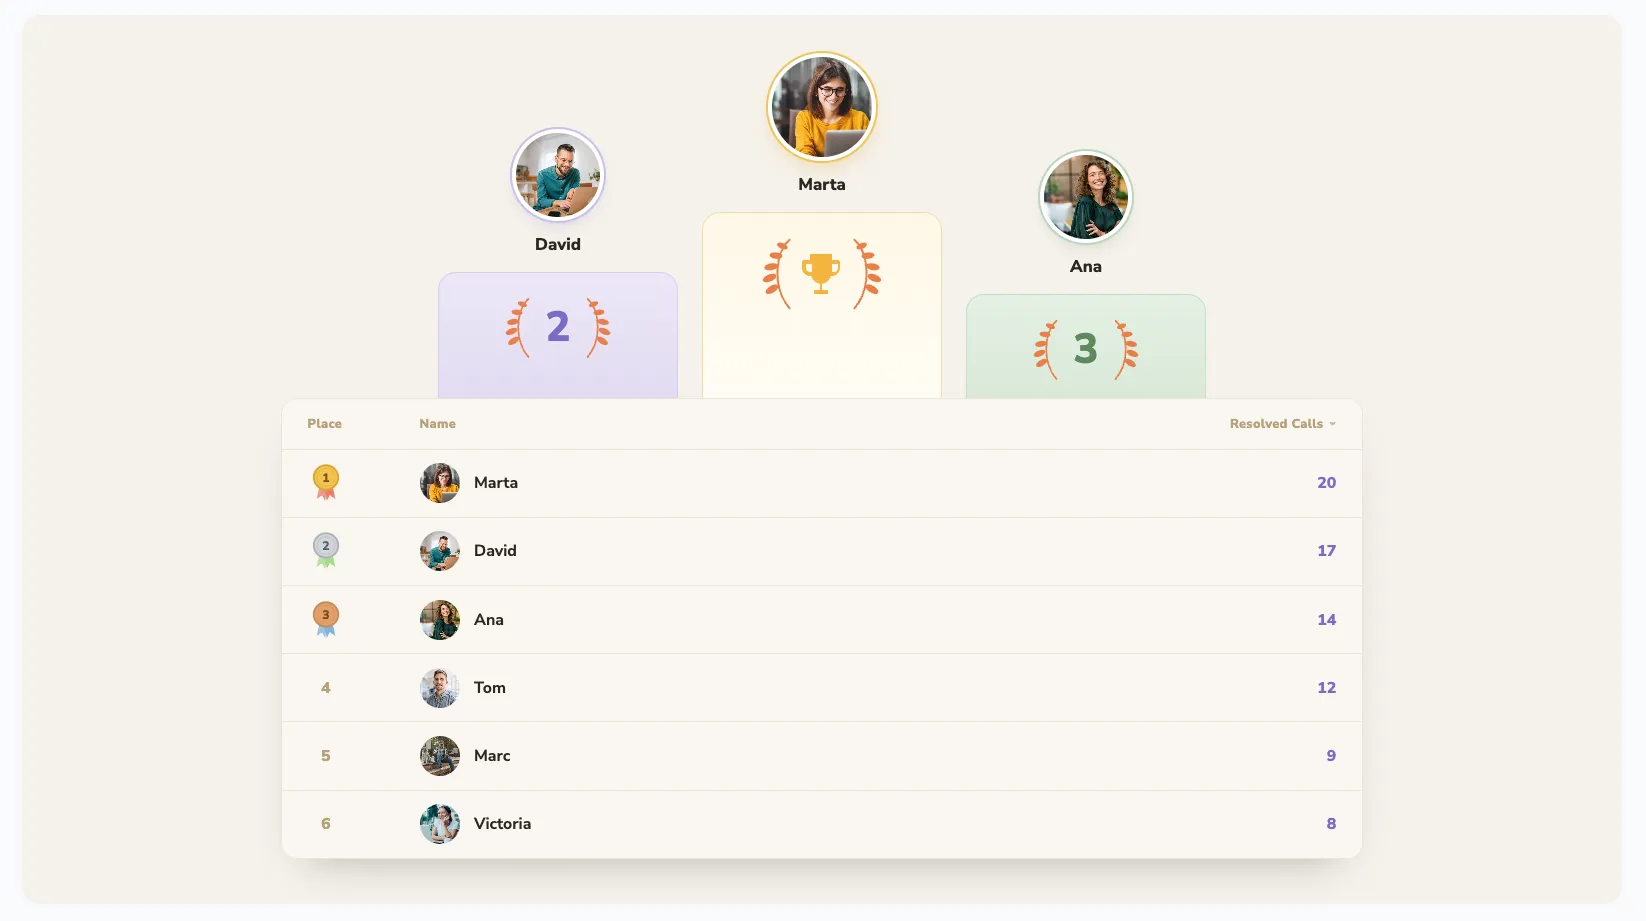
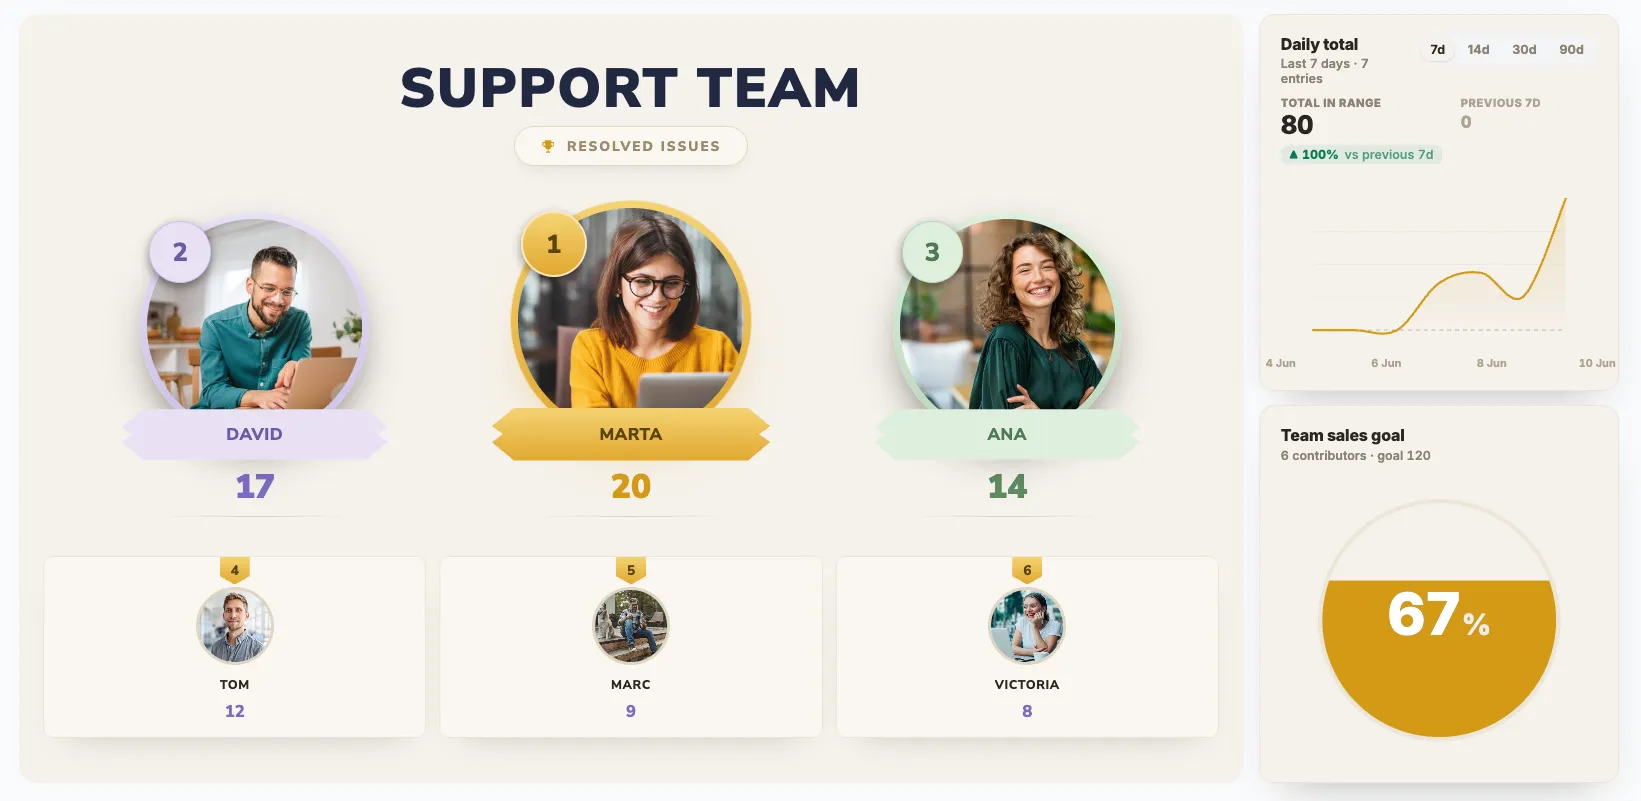
Your whole support team on one screen - with the goal in plain sight.
Top agents get the spotlight, the rest of the floor ranks below, and a live team goal gauge shows how close you are to the day's target. Built for the back wall of the support floor or the office TV.
- Medallions and avatars for the top performers
- Any support KPI - resolved tickets, CSAT, calls handled
- Live team goal gauge and daily trend
- Dark theme tuned for large office displays
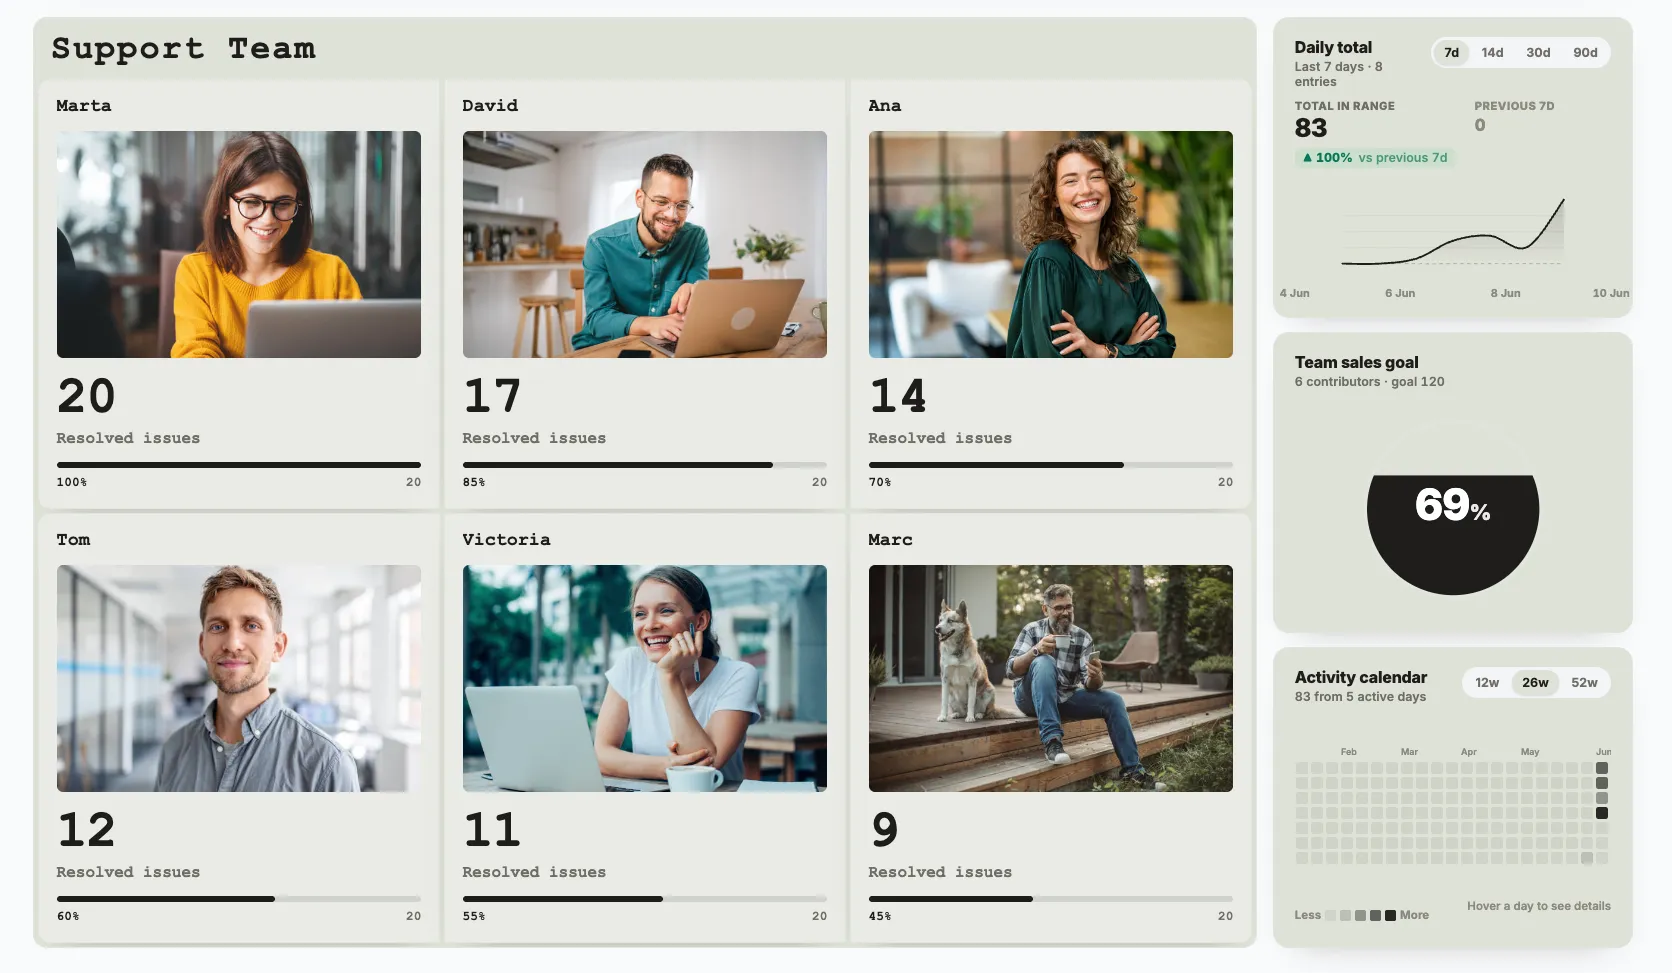
A support agent performance dashboard everyone can read at a glance.
The scorecard view shows each agent's resolved issues, a live progress bar toward target and the team's daily momentum. Set daily, weekly or shift-based goals and watch the bars fill in real time as tickets close - an agent scorecard and KPI dashboard in one screen.
- Individual targets per agent or a shared team goal
- Progress-to-target bars with exact percentages
- Daily total trend and activity heatmap
- Auto-rollover at the end of each period
One dashboard, every support floor.
From inbound call centers to SaaS help desks to BPO operations - a live dashboard works wherever there's a queue to clear and a KPI to track.
Office TV & Wallboard Dashboards
Show resolved tickets, CSAT and handle time on the office TV or floor wallboard. Real-time updates - no refreshing needed.
Help Desk & Ticket Dashboards
Track resolved-ticket volume across your Zendesk, Freshdesk or Intercom queues. Watch the backlog shrink in real time.
CSAT & Quality Dashboards
Track customer satisfaction and QA scores so quality stays visible, not just speed. Reward the agents customers love.
Help Desk Integration
Push KPIs directly from Zendesk, Freshdesk, Intercom or Salesforce Service Cloud via REST API. Updates the moment a ticket resolves.
SLA & Response-Time Dashboards
Keep first-response and resolution time on the wall during peak hours and ticket spikes. Stay inside SLA when it counts.
New-Agent Ramp Tracking
Track onboarding milestones: first resolved ticket, first five-star CSAT, first solo shift. Build momentum from day one.
Multi-Team & BPO Dashboards
Compare shifts, sites or BPO partners on one board. Perfect for seasonal volume, launches and big support pushes.
Remote & Hybrid Support
Share the dashboard in Slack and Teams, or embed it in Notion. Distributed agents see the same live KPIs as the office TV.
Feed the dashboard from your help desk in three lines.
Don't make agents update the board. Don't make your ops team copy-paste from Zendesk. Push KPIs straight from the source of truth - a trigger, an automation, or one curl from your terminal.
- Zendesk - fire a trigger on ticket solved
- Freshdesk - automation rule webhook on resolve
- Intercom / Help Scout - Zapier or direct webhook
- Your own stack - any tool that can POST JSON
# Fire this from your help desk webhook on ticket solved
curl -X POST https://api.boardq.io/v1/scores \
  -H "Authorization: Bearer $BOARDQ_API_KEY" \
  -H "Content-Type: application/json" \
  -d '{
    "board_id": "support-dashboard-today",
    "participant": "Marta Nowak",
    "score": 20,
    "unit": "tickets"
}'Everything a support dashboard needs. Nothing it doesn't.
⚡ 60-second setup
Create a dashboard, add agents, share the link. No software to install, no data modelling, no IT ticket.
🔄 Real-time updates
KPIs update live across every screen over WebSocket. Resolve a ticket, the office TV refreshes instantly.
📺 Built for the office TV
Full-screen, high-contrast themes designed to be readable from across the support floor and wallboard.
🖥️ Embed anywhere
Drop the dashboard into Slack, Teams, Notion or your agent intranet with a single iframe.
🎨 Custom branding
Upload your logo, pick your colors. Make the dashboard feel like it belongs in your support center.
🔌 REST API + webhooks
Push from Zendesk, Freshdesk or anywhere. Pull KPIs into weekly ops reviews programmatically.
🔒 Private dashboards
Password-protect dashboards so agent performance stays inside the team.
📱 Works on every device
Agents check the dashboard from their phone between calls. Works in any browser, no app to install.
“The data was in Zendesk the whole time - nobody looked at it until the monthly QA review. We put BoardQ on the floor TV as a live dashboard and now the queue moves itself. New hires can see what ‘good’ looks like from day one.”
Common questions.
What is a customer support dashboard?
A single live view of the metrics that drive a support team - resolved tickets, CSAT, SLA, handle time and queue volume - shown in real time so the whole team can see where they stand. BoardQ turns help desk data into a support KPI dashboard you can put on the office TV in under a minute.
Can I run it as an office TV dashboard?
Yes - that's the primary use case. Open the dashboard in any browser on a smart TV or wallboard, click full-screen, and it auto-refreshes via WebSocket. The dark theme is tuned for large displays.
Does it work as a helpdesk or service desk dashboard?
Yes. BoardQ works as a customer service dashboard, helpdesk dashboard or service desk dashboard - any metric your help desk records can become a live tile. Run a ticket dashboard for volume and a quality dashboard for CSAT off the same roster.
Is it a real-time support KPI dashboard?
Yes. Every score updates live the moment it changes - resolve a ticket or log a CSAT survey and the office TV refreshes instantly. No nightly batch, no refresh button.
Can it show per-agent scorecards?
Yes. The scorecard view shows each agent's resolved issues, a live progress bar toward target and the team's daily momentum - a support agent performance dashboard and scorecard in one screen.
Does it integrate with my help desk?
Yes. BoardQ exposes a REST API. Push scores from Zendesk, Freshdesk, Intercom, Help Scout, Salesforce Service Cloud or anything that supports webhooks. Zapier works too if you don't want to write code.
Which support metrics can I track?
Anything with a number: resolved tickets, resolved calls, CSAT, first-response time, average handle time, SLA compliance, QA score, calls answered. You set the unit label to match your KPI.
Is the support dashboard free?
Yes. The free plan includes 2 dashboards with unlimited agents, real-time updates, all themes and API access. Premium starts at $8.99/month for unlimited dashboards and custom branding.
Your support dashboard can be live on the TV in 60 seconds.
Free to start. Unlimited agents. No credit card. Upgrade only when you need more dashboards or custom branding.
No setup fee · No contract · Cancel anytime